
Download your collected survey responses as a data file — CSV, TSV, Excel, JSON, or SPSS — for analysis in spreadsheets, statistics packages, or your own tools.
This guide covers the response data export — the answers people submitted. To export the questionnaire (the questions themselves) as a JSON or Word file, see Exporting a survey.
Before you start#
To export responses you need:
- To be signed in to the survey builder.
- A survey that has collected responses. Export lives on the survey's analytics page; a survey with no responses still shows the header and an empty responses table with a "No responses yet" message, but no Export button.
- The survey must be one you built in this platform (imported/third‑party surveys show only a Trends view and have no Export button).
Where to find Export#
Open your survey and go to Field Analytics
(Surveys → your survey → analytics), then select the Total Responses tab. The
Export button sits at the right of the responses toolbar.
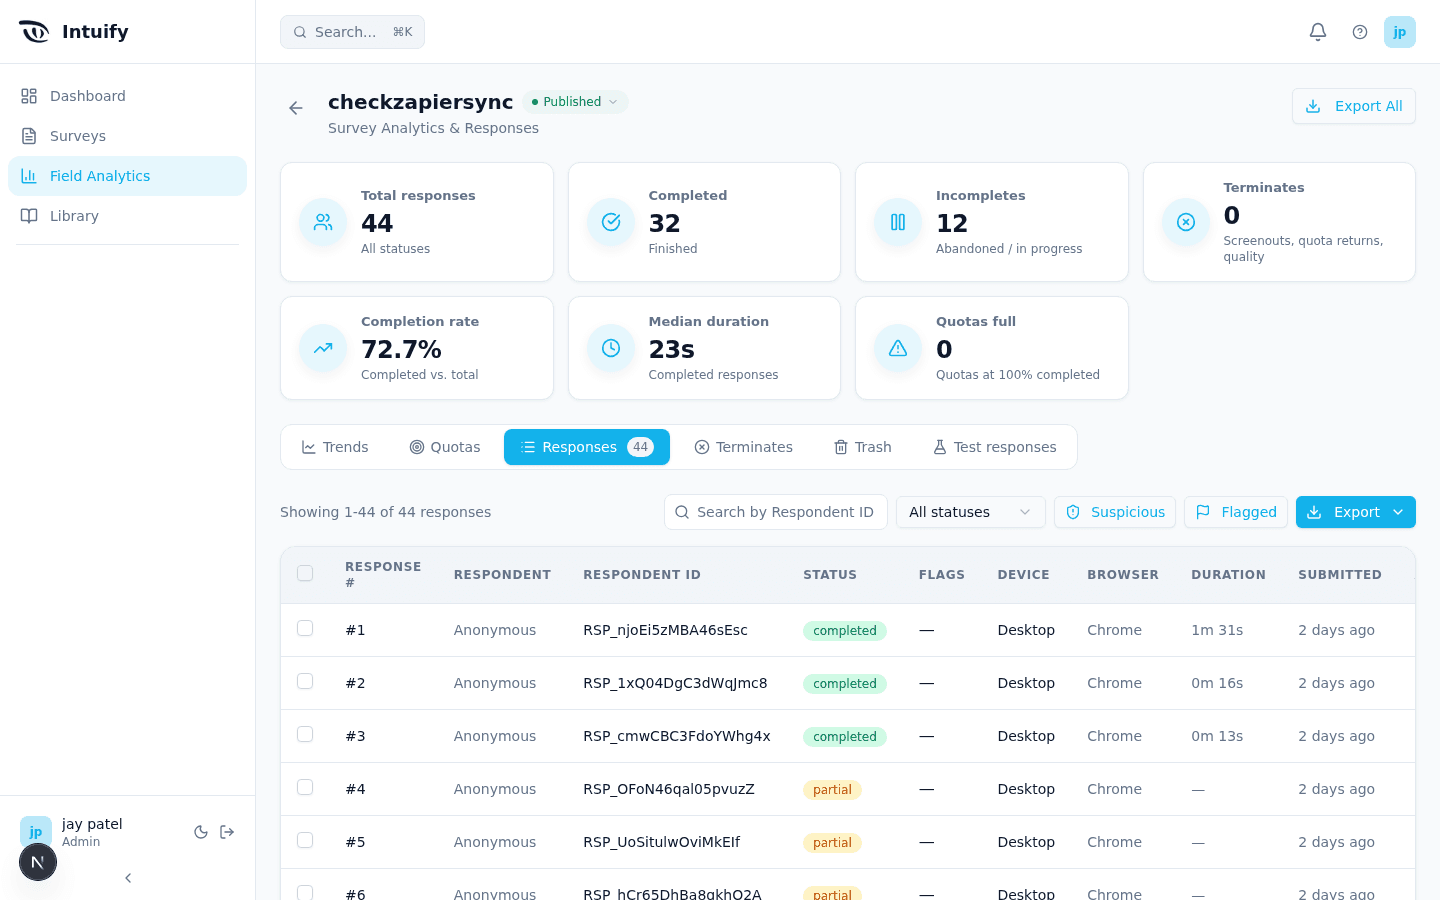
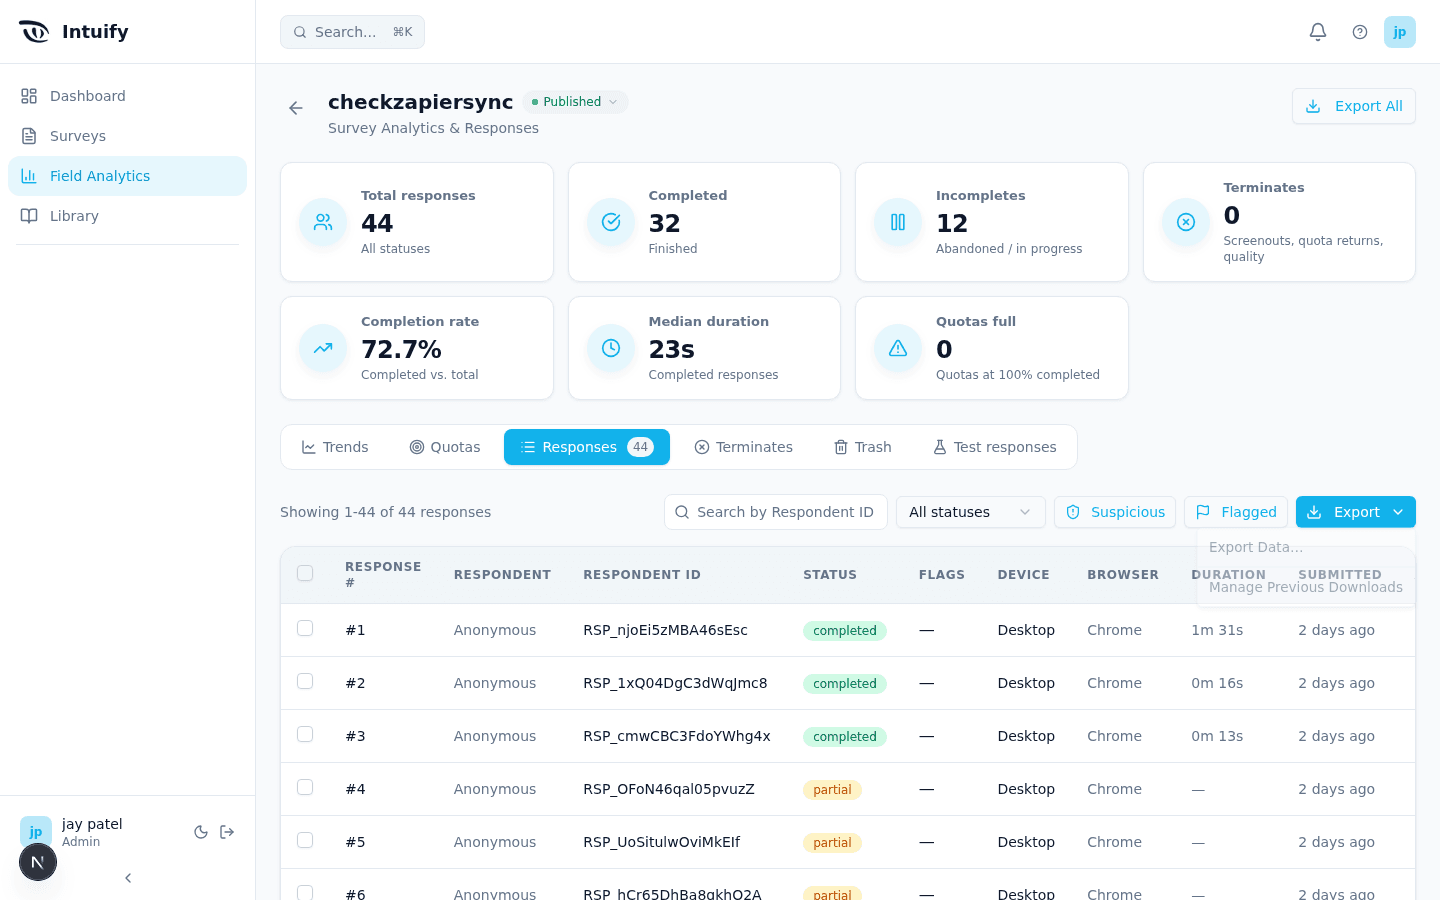
Click Export to open the menu. It has two items:
- Export Data… — pick a format and download a data table.
- Manage Previous Downloads — see and re‑download your recent exports.
Step-by-step: download a data table#
- On the Total Responses tab, click Export → Export Data….
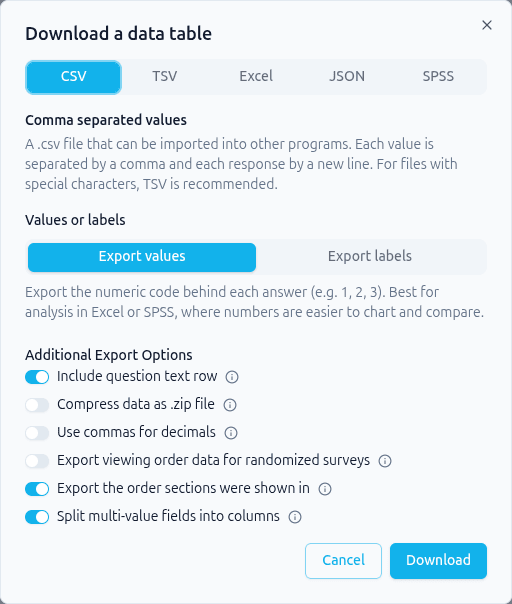
- Pick a format across the top (CSV, TSV, Excel, JSON, SPSS).
- Choose Export values or Export labels (see below).
- Set any Additional Export Options you need (question text row, compress, split multi‑value).
- Click Download.
- The dialog switches to Manage Downloads, where your export is prepared in the background. When it's ready, click Download on its row.
Exports run in the background — you don't have to wait on the dialog. Large exports keep preparing even if you navigate away; find them later under Manage Previous Downloads.
Choosing a format#
| Format | File | Best for |
|---|---|---|
| CSV | .csv | Importing into most tools. One value per comma, one response per line. For answers with special characters, prefer TSV. |
| TSV | .tsv | Opening in Microsoft Excel when answers contain commas or special characters (tab‑separated). |
| Excel | .xlsx | A ready‑to‑open Excel workbook, one row per response. |
| JSON | .json | Feeding your own code / integrations — an array with one object per response, keyed by column name. |
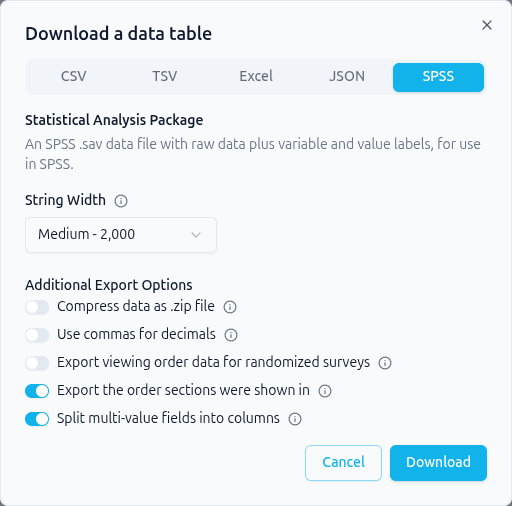
| SPSS | .sav | Statistical analysis in SPSS, with variable and value labels attached. |
CSV, TSV, Excel, and JSON share the same columns and the Values / Labels
choice. SPSS is always exported as coded values (with labels attached inside
the .sav file) and adds a String Width control instead.
Values vs. Labels#
Every choice‑based answer can be exported two ways:
- Export values — the numeric code behind each answer (e.g.
1,2,3). Best for analysis in Excel or SPSS. (This is the default.) - Export labels — the answer text the respondent actually saw
(e.g.
Very satisfied).
The codes are stable: they come from each question's recode values, so they keep working even if you later edit the wording of a question or answer.
Export options#
The dialog shows these toggles (defaults noted):
| Option | What it does |
|---|---|
| Include question text row (on by default) | Adds a second header row under the column names showing each question's full wording. Turn it off for a single header row of column names only. |
| Split multi-value fields into columns (on by default) | Gives each choice of a multi‑select question its own column (1 when selected). Turn off to list all selected choices together in one column. |
| Compress data as .zip file | Downloads the file inside a .zip archive — useful for large exports or slow connections. |
| Use commas for decimals | Writes decimals as 3,5 instead of 3.5 (for locales that use comma decimals). |
| Export viewing order data for randomized surveys | Adds a column per question whose answers or matrix rows are randomized, listing the choices in the order that respondent saw them. See Viewing order below. |
| Export the order sections were shown in | On by default. For a survey whose flow randomizes whole sections, adds two columns per section: the position that respondent saw it in, and when they first reached it. See Viewing order below. |
SPSS: String Width#
On the SPSS tab, Values / Labels is replaced by String Width — the
maximum length (in characters) for open‑text answers stored in the .sav file:
Small – 250, Medium – 2,000 (default), or Large – 20,000.
Viewing order#
When a survey randomizes what respondents see, the order each person saw things in is usually a variable you want in the analysis: whatever someone sees first tends to score better simply for being first. The export reports that order in two places, and they answer different questions.
Which section they saw first#
If your Survey Flow has a Randomizer presenting a set of sections — the usual setup for concept testing, one concept per section — every export gets two extra columns per section, at the far right of the file, after all the question columns:
| Column | What the cell holds |
|---|---|
<Section>_ViewOrder | The position that respondent saw that section in. 1 means they saw it first. |
<Section>_FirstViewed | When they first landed on it. |
A section the respondent never reached is left blank — not 0 and not 1,
so a partial completion can't be mistaken for someone who saw everything.
You don't need to turn anything on for these. Export the order sections were shown in is ticked for you, so they appear on any survey with a Randomizer in the flow, and nothing is added to surveys without one. Untick it if you would rather the file did not carry them.
These columns compare one respondent against the others who took the study, so they are only in the full Export Data file. Exporting a single response from the Response Details window leaves them out.
Reading the row: the column is the section and the cell is its position. A row with
Concept B_ViewOrder = 1means that respondent saw Concept B first.
Which order the choices inside a question were shown in#
Tick Export viewing order data for randomized surveys to also get the order within individual questions. For each question that randomizes its answers or its matrix rows, the file gains one column:
| Column | What the cell holds |
|---|---|
<Tag>_DO | The question's answers, in the order shown, separated by |. |
<Tag>_RO | For a matrix, its statement rows in the order shown. |
The cells follow your Values / Labels choice, exactly like every other
answer column: 3\|1\|2 when exporting values, Gamma\|Alpha\|Beta when
exporting labels.
Questions that don't randomize get no column, so ticking this on a survey with no randomization changes nothing. A respondent whose order wasn't recorded — including anyone who answered before this option existed — is left blank rather than showing the authored order, so you're never given a made-up order to analyze.
Which responses get exported (filters)#
An export includes exactly the responses currently shown on the Total Responses tab. Whatever you've filtered to carries into the file:
- Status — Completed, Partial, and/or Terminated.
- Suspicious / Flagged toggles.
- Real vs. Test responses — the Total Responses tab exports real responses; the Test responses tab exports test data.
There is no date‑range picker in this dialog — narrow the set with the Total Responses‑tab filters before exporting if you need a subset.
Managing your downloads#
Because exports are prepared in the background, they appear in Manage Downloads (opens automatically after you click Download, and any time from Export → Manage Previous Downloads).
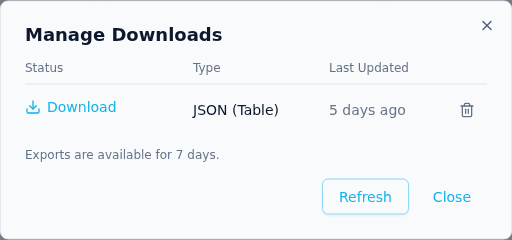
Each row shows:
- Status — a spinner + Preparing… while it builds, a Download link when ready, or Failed if something went wrong.
- Type — the format (e.g. CSV (Table), Excel (Table), SPSS (.sav)).
- Last Updated — a relative time.
- A trash icon to delete an export.
Use Refresh to update the list. Exports are available for 7 days, after which they're removed automatically — re‑run the export if you need it again.
Understanding the exported columns#
The tabular formats (CSV, TSV, Excel) follow a Qualtrics‑style layout so the files are familiar to analysts.
Two header rows lead each file:
- Column tag — a short, stable name (your question's export tag, e.g.
Q1,Q2_1). - Question text — the full wording. A question with no wording of its own
is labelled by its tag instead, so the file never shows the builder's
"update question text here" placeholder. Sequential Select is the usual
case: it has no question text field, and each slide's statement already
names its own column — e.g.
Q12 - Burt's Bees - Which brands did you consider buying?.
Turn off Include question text row in the export dialog and the file leads with the column tags alone.
Line breaks inside open‑text answers are always replaced with spaces in the table formats (CSV, TSV, Excel and SPSS), so a pasted paragraph stays on one spreadsheet row. JSON and XML keep the answer exactly as it was typed, line breaks included, since neither has rows to fall out of alignment.
Internal database ids are never written to the file — column tags use your
question tags (or a stable QID{n}), so exports are safe to share.
Blocks that collect no answer get no column: Instructions, Create / Edit
Global Variables and Display Global Variables. A variable that a Create / Edit
Global Variables block sets still appears, in its own column named after the
variable. Skipping these blocks doesn't renumber anything, so a question keeps
the same QID{n} it would otherwise have.
System columns lead each response: StartDate, EndDate, Status,
Progress, Duration, Finished, RecordedDate, ResponseId,
UserLanguage, ResponseStatus, TerminationType, MarkedCompleteAt, and
PromotedFrom. Device / browser / OS and location columns are included with
the full‑fields set.
How the file says a response ended:
| Column | What it holds |
|---|---|
Status | The response type: 0 for a real response, 1 for a preview or test. It is not a completion indicator. |
Finished | 1 when the response counts as finished — the respondent reached the end, or an analyst marked the response complete. 0 when neither happened. |
ResponseStatus | completed, partial, or terminated. This is the one to read for completion. |
TerminationType | screenout, quota_return, or quality_control for a terminate. Blank for an untouched complete or partial, and complete for a response someone marked complete by hand — so read ResponseStatus, not this column, to decide whether a response was terminated. |
MarkedCompleteAt | Blank for almost every response. When an analyst marked a response complete, it holds the date and time they did so (UTC). |
PromotedFrom | Blank for almost every response. When an analyst marked a terminated response complete, it holds the termination type it carried beforehand. |
PromotedFrom matters because promoting a response rewrites its
TerminationType, so on its own the file would show a plain complete with
nothing to say it was ever a screen-out. If your delivery counts must exclude
promoted respondents, filter on MarkedCompleteAt — it is filled in for every
response an analyst promoted, including one promoted from a partial, which was
never terminated and so has no PromotedFrom to filter on.
Per‑question column grammar:
| Question type | Columns | Cell value |
|---|---|---|
| Single choice | Q | the chosen answer's code / label |
| Multi‑select (split on) | Q_1, Q_2, … (one per choice) | 1 if selected, blank if not |
| Multi‑select (split off) | Q | all selected choices joined together |
| Matrix — single per row | Q_1, Q_2, … (one per statement / row) | the chosen scale point |
| Matrix — multi / grid | Q_1_1, Q_1_2, … (row × column) | 1 selected / typed value |
| Ranking | Q_1, Q_2, … (one per item) | the rank that item received |
| "Other, please specify" | Q_2_TEXT | the free‑text the respondent typed |
Unanswered cells are blank by default.
Test responses#
Responses you submit while testing (via a test link or preview) are kept separate. Open the Test responses tab — it has the same Export menu and dialog — to download test data without mixing it into your real results.
FAQ & troubleshooting#
I don't see an Export button. Make sure you're on the Total Responses (or Test Responses) view of a survey that has responses. A survey with none shows a "No responses yet" message in the table.
My export only has some responses. The file matches the view you export from and its active filters (status, suspicious, flagged). Exporting from the Completes, Incompletes, or Terminates view downloads only that group; use Total Responses with filters cleared to export everything.
The download says "Preparing…" for a while. Exports build in the background; large surveys take longer. You can leave the dialog — find the finished file later under Manage Previous Downloads.
My download link disappeared. Exports are kept for 7 days. After that, re‑run the export.
Which should I pick — values or labels? Use values (numeric codes) for statistical analysis, and labels (answer text) when you want human‑readable output. SPSS always uses values but carries the labels inside the file.
SPSS export failed.
SPSS .sav generation requires the server‑side statistics toolchain; if it's not
configured in your environment, choose CSV / Excel instead or contact your
administrator.
Was this page helpful?