
Mode: configuration.maxDiffDesign = "top_n_bandit"
Demo survey: SV_wIO3EXLAKKRZrDjC · respondent link /s/wxD02ewKFVok
What it is#
The adaptive mode (PPT slides 2, 3, 6). After a minimum number of respondents, the R model
(survival::clogit) estimates per‑item utilities + standard errors on the aggregate group.
Those are injected into each new respondent's session before the question loads, and the
widget shifts exposure toward the contested top‑X% items so their ranking sharpens fastest.
Every item keeps a small (floored) chance so its utility keeps refreshing.
Configuration used#
| Setting | Value |
|---|---|
| Design of Experiment | Top‑N Bandit |
| Focus on Top X% | 30% |
| Min respondents before adaptive sampling | 3 |
| Update adaptive sampling every N respondents | 1 |
| Number of screens | 6 |
| Items per screen | 4 |
| Items | 8 |
Step 1 — seed responses → the R model runs#
We submitted 5 completed responses that consistently preferred Price/Quality and disliked Customer support/Delivery speed. On reaching the minimum (3), the backend called the R runner (via the sync‑gateway) and stored a versioned result (v1, n=5). Estimated utilities:
| Item | Utility | SE |
|---|---|---|
| Price | 20.55 | 0.32 |
| Quality | 1.79 | 0.99 |
| Brand reputation | 0.06 | 0.83 |
| Design | −1.83 | 0.83 |
| Warranty | −3.41 | 0.85 |
| Eco‑friendly | −3.69 | 0.85 |
| Customer support | −6.02 | 0.82 |
| Delivery speed | −7.46 | 1.00 |
The ranking matches the seeded preference exactly. The top‑30% cutoff (3rd‑ranked of 8) is Brand reputation, so Price / Quality / Brand get high sampling weight; the rest get low (but non‑zero) weight.
Injection happens at session start, so the latest result reaches each new respondent before the first screen renders (confirmed: the session payload carried all 8 utilities).
Step 2 — fresh respondent, live run#
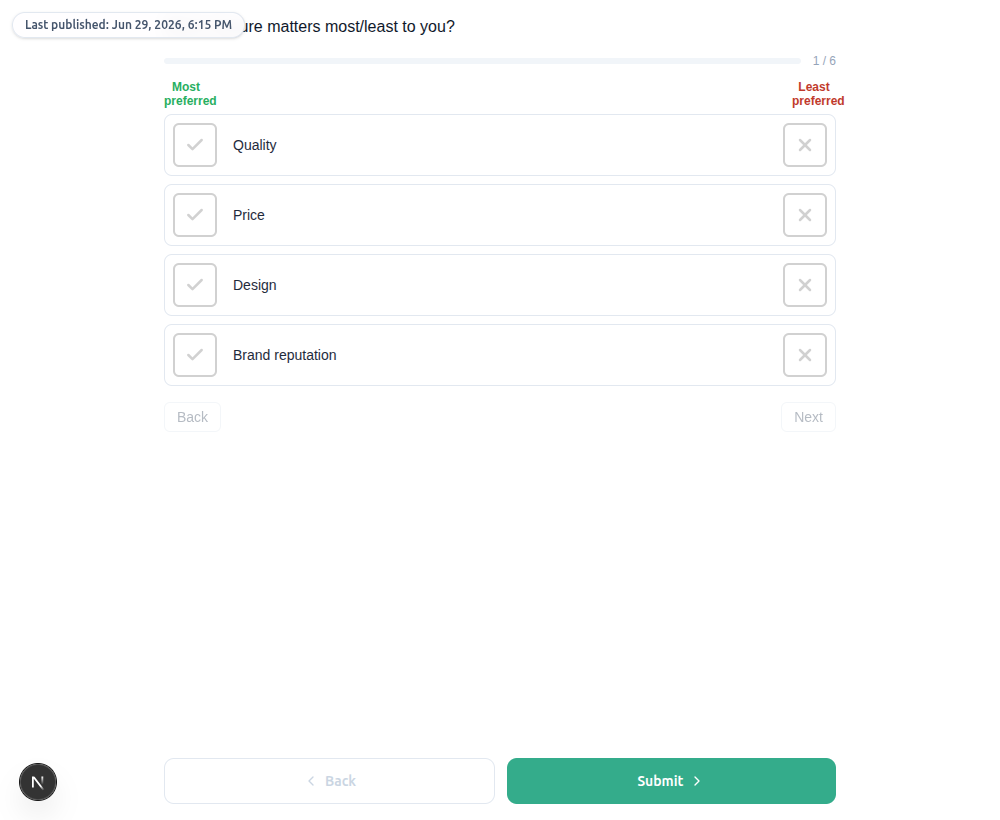
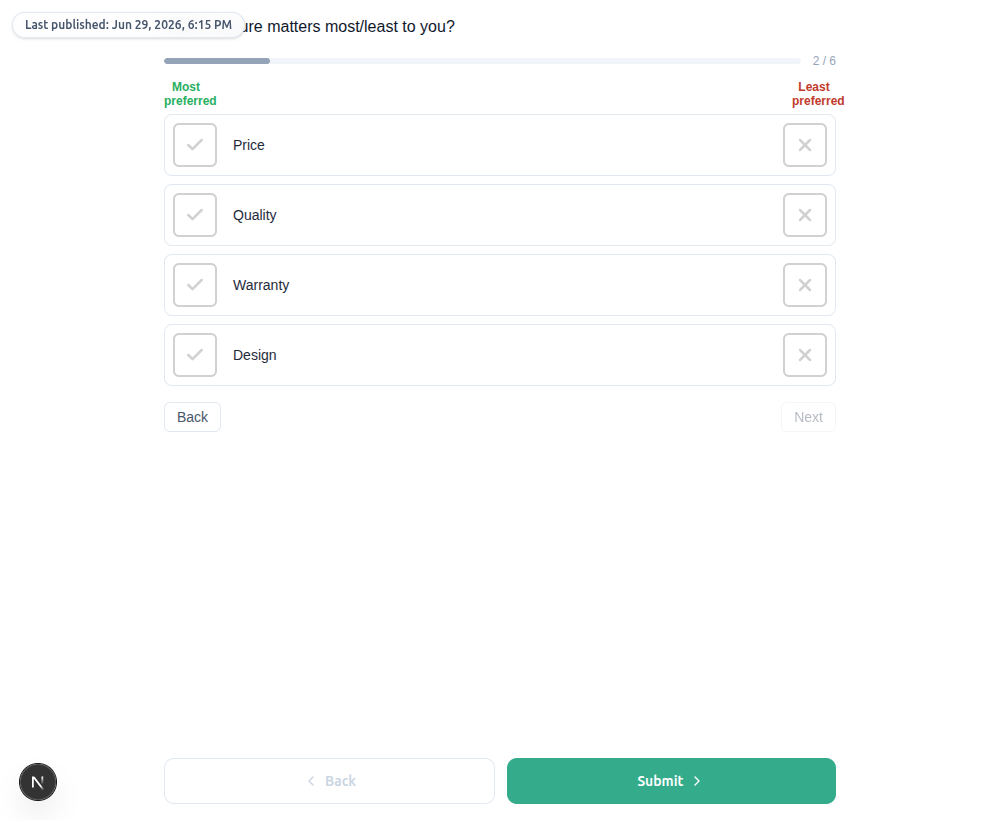
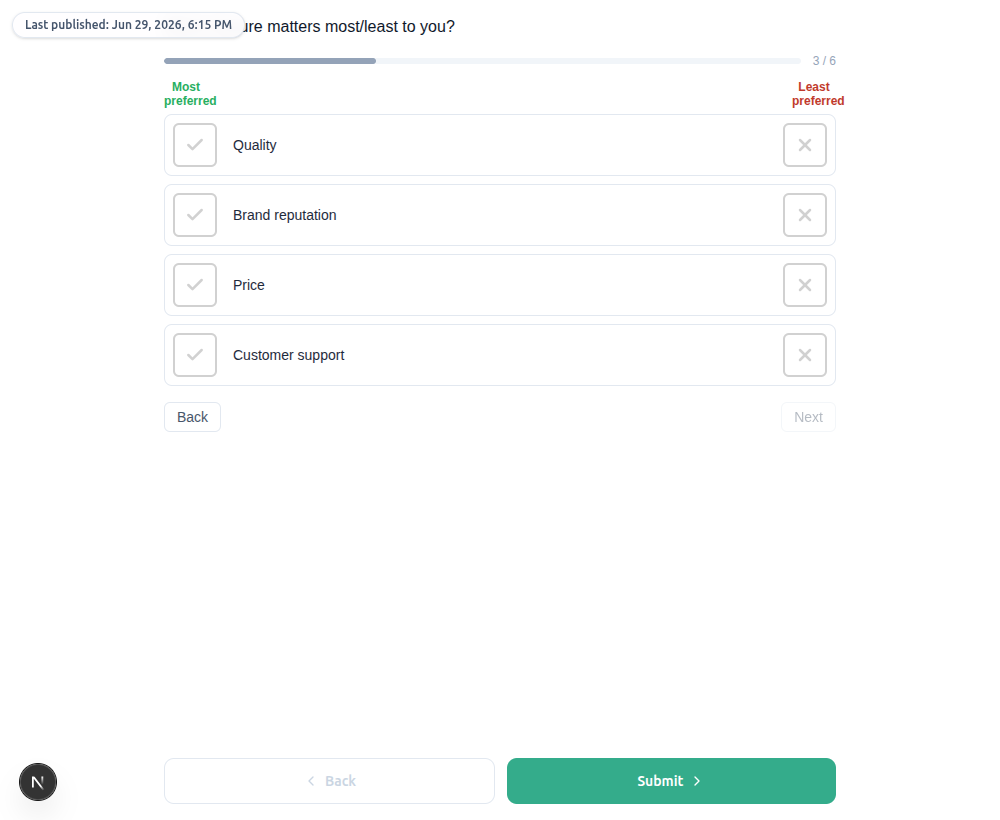
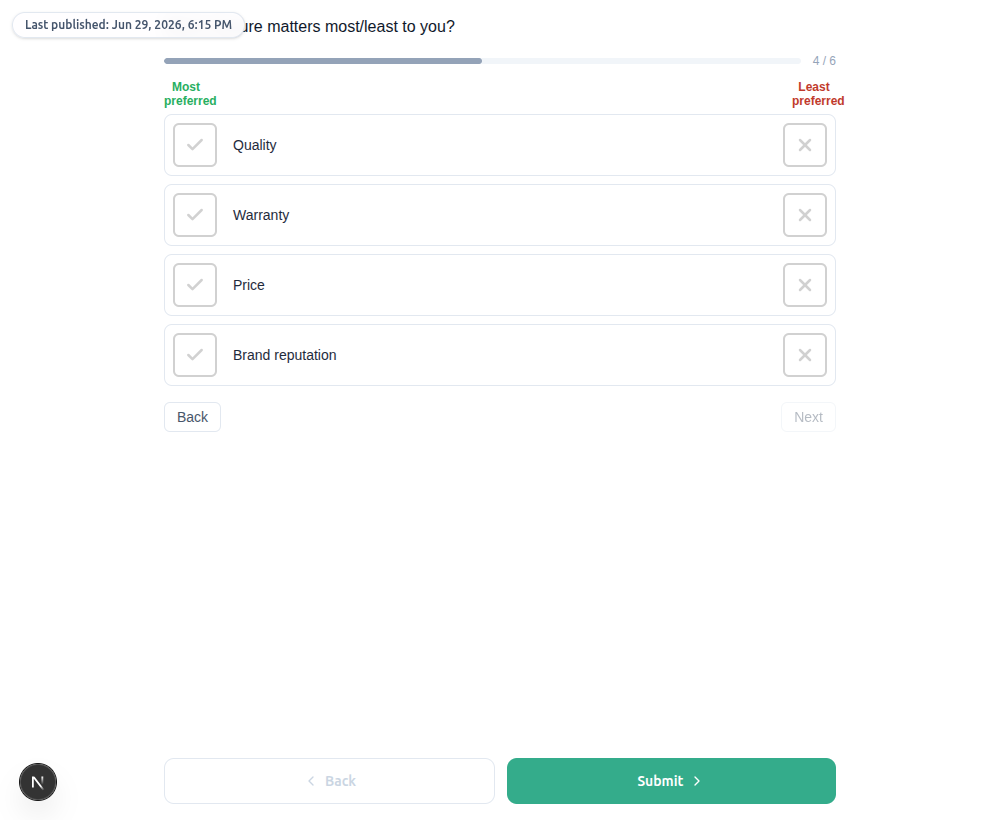
A brand‑new respondent then saw screens visibly concentrated on the top items:
| Screen | Items shown |
|---|---|
| 1 | Quality · Price · Design · Brand reputation |
| 2 | Price · Quality · Warranty · Design |
| 3 | Quality · Brand reputation · Price · Customer support |
| 4 | Quality · Price · Brand reputation · Warranty |
| 5 | Price · Quality · Design · Warranty |
| 6 | Quality · Brand reputation · Design · Delivery speed |
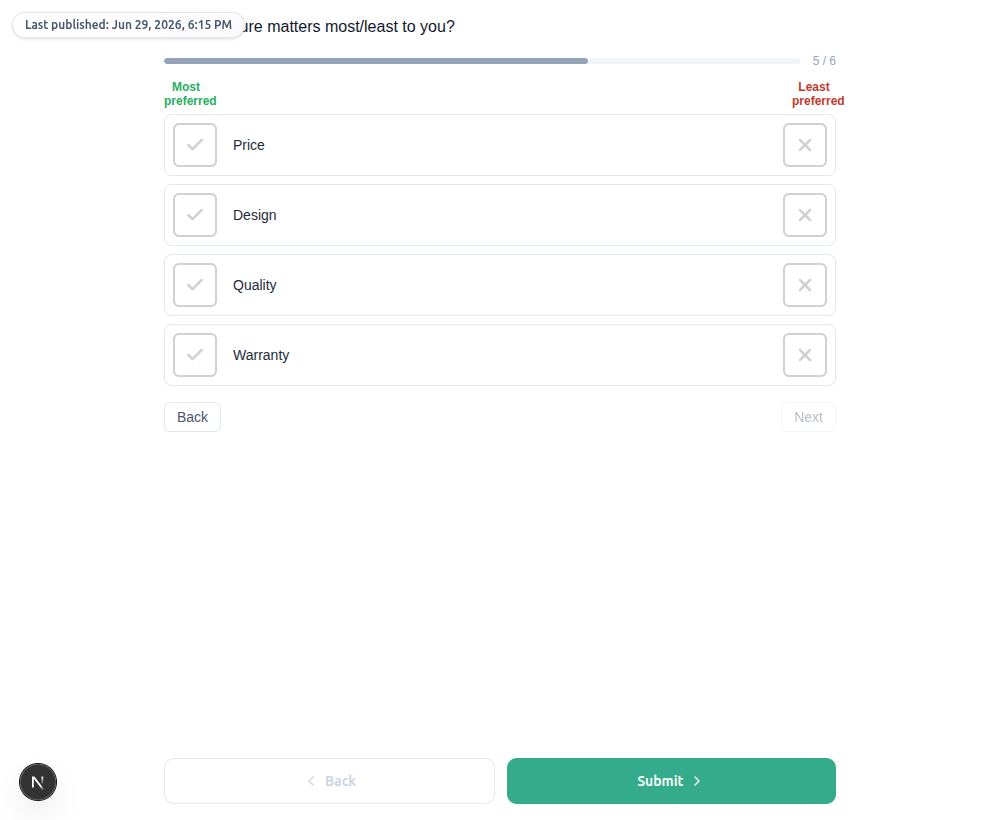
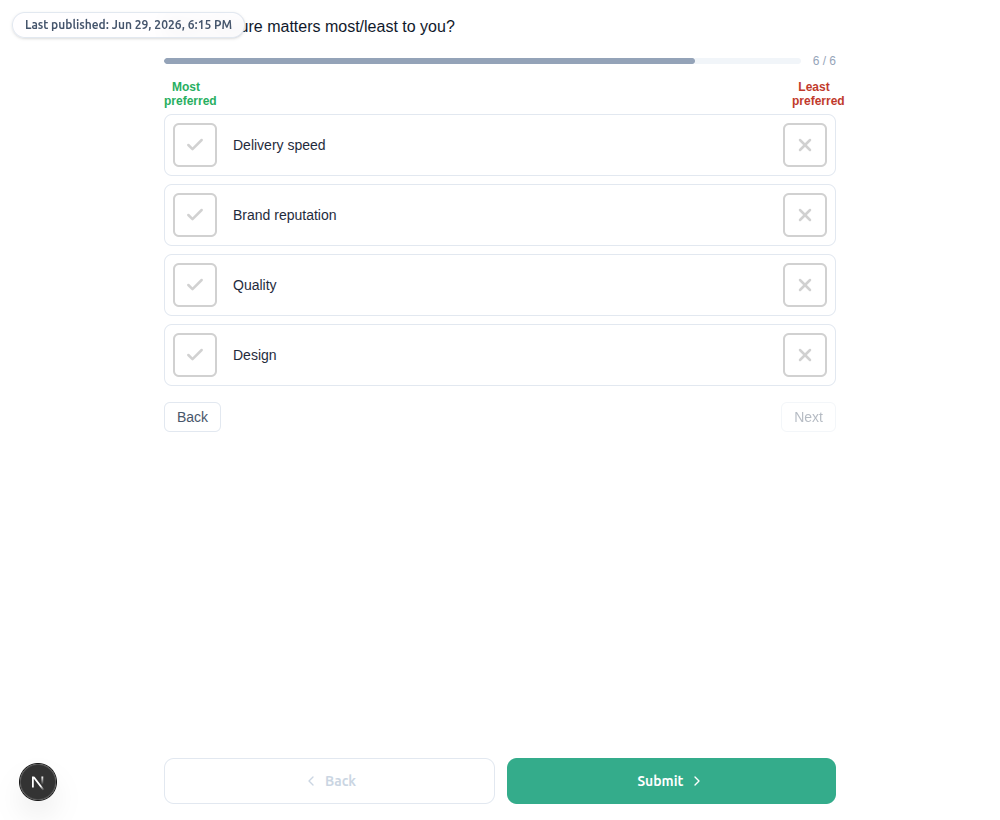
Result — exposure shifts to the top‑X%#
| Item | Utility rank | Times shown |
|---|---|---|
| Quality | 2 | 6 (every screen) |
| Price | 1 | 5 |
| Design | 4 | 4 |
| Brand reputation | 3 | 4 |
| Warranty | 5 | 3 |
| Customer support | 7 | 1 |
| Delivery speed | 8 | 1 |
| Eco‑friendly | 6 | 0 (this draw) |
Compared with the Standard design (every item exactly 3×), the Bandit pushed the top items to 5–6× and the bottom items down to 0–1×. Exposure now tracks utility — exactly the "focus on the contested top‑X%" behaviour the spec calls for.
How the weight is computed#
cutoff= utility at the top‑X% boundary (here = Brand reputation).weight = 0.1 + logistic((utility − cutoff) / SE)→ top items ≈ 1.1, bottom ≈ 0.1.- Each screen is filled by weighted‑random sampling:
P(pick) ∝ weight / (1 + appearances), so top items dominate while the floor keeps low items occasionally sampled.
The sampling seed combines the question with the respondent's session id, so two respondents carrying the same utilities still draw different screens — the weighting decides how often an item appears, not which fixed set everyone sees.
Constraints#
Item‑pair constraints authored in the Constraints panel are honoured here exactly as in the Standard design: a constrained partner is excluded from the candidate pool for that screen, whatever its weight. Before the model has run the Bandit falls back to the Standard balanced design, which applies the same constraints.
Live loop / versioning#
Every N completed responses the model re‑runs and stores a new version (v1, v2, …); the next respondent's session injects the latest. There is no rebuild of the question — only the data (utilities/SEs) changes, applied at runtime.
Was this page helpful?